Table of Content
- Introduction
- Why do we use Isotonic Regression?
- Understanding of Isotonic Regression with Positive Slope (Non-Negative Slope).
- Difference between Isotonic Regression and Linear Regression
- Advantages of Isotonic Regression
- Disadvantages of Isotonic Regression
- Application of Isotonic Regression
- Working with Isotonic Regression using Python
- Conclusion and Summary
Introduction
Isotonic word is derived from Greek words ISO which means equal and TONOS which means to stretch. we can say that doing equal stretching along linear regression. It is a non-parametric regression technique which is used when the direction is strictly increasing(function). Non-parametric means nonlinearity among the variable in function. It plots the points as near as possible to observation. It is basically based on linear regression but is more efficient. It is not known to many people, but it is a very powerful tool. It is also known as monotonic regression because it uses monotonic constraint. It is a piece wise linear model. It can be used to predict sequence of observations in continous target data.
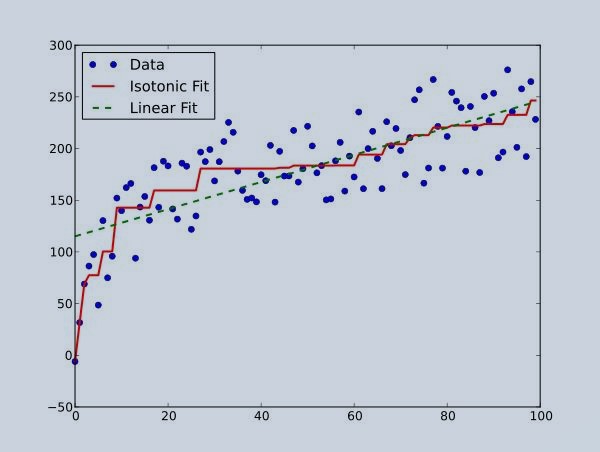
Figure 1 : Isotonic Regression Illustration
In this graph, we can see linear as well as isotonic regression. As you can see the isotonic line is free line which is non-decreasing and line can be adjusted according to data.
Why do we use Isotonic Regression?
Most of the time linear regression is enough to achieve high prediction score, but sometimes it is not able to find the internal kernel of dataset (function’s observation). we can say that linear regression is inflexible. So, in python there is class named isotonic regression which produces piece wise interpolating function. We use isotonic regression to observe the point (non -decreasing dataset) and try to adjust that line to some level. It is also used when you don’t have to make assumption for target function (example - linearity).
Understanding of Isotonic Regression with positive slope (non-negative slope).
In Isotonic Regression, the slope of the solution should always be positive (non-negative). The slope should always increase when moving from one previous observation point to next observation point.
For Example – Let x1, x2, x3 be the data points with the slope as s1, s2, s3. Then as per the concept the slope should be positive.
Hence,
F(x1) <= f(x2) <= f(x3)
In this example, we started with lowest point f(x1) and gradually move to the higher point. In isotonic regression the slope can be zero, but it cannot be negative.
Difference between Isotonic Regression and Linear Regression
- Isotonic regression has to be non-negative whereas in linear regression can be negative. This means every point in isotonic regression should be high as before the previous point.
- Isotonic can be free form but linear regression should be linear.
Advantages of Isotonic Regression
- It offers multidimension scaling which means we can analyse each and every dimension and then can interpolate in a function in a linear way.
- It does not constraint on any function such as linearity as the function is monotonically increasing.
Disadvantages of Isotonic Regression
- While using isotonic regression there can be problem of over fitting because monotonic constraint and prediction value increases.
- Real life application and data related to same may not have increasing trend data as required by Isotonic used cases.
Application of Isotonic Regression
It can be used for calibration of probability value. For example- we are using logistic regression on some dataset and then we find out that the probability value can increase. So, we can use isotonic regression to increase the probability value.
Working with Isotonic Regression using python
Step 1: Importing all the Libraries
    import numpy as my_np
    import matplotlib.pyplot as my_plt
    from matplotlib.collections import LineCollection
    from sklearn.linear_model import LinearRegression
    from sklearn.isotonic import IsotonicRegression
    from sklearn.utils import check_random_state
Step 2: Creating DataSet
    a = 100
    b = my_np.arange(a)
    c = check_random_state(0)
    d = c.randint(-50,50,size=(a,))+ 50. * my_np.log1p(my_np.arange(a))
Step 3: Fitting Dataset in Isotonic and Linear Regression Models
    iso = IsotonicRegression()
    d_fit= iso.fit_transform(b,d)

    my_lr = LinearRegression()
    my_lr.fit(b[:,my_np.newaxis],d)
Step 4: Plotting the results
    data_segments = [[[i,d[i]],[i,d_fit[i]]] for i in range(a)]
    lcol = LineCollection(data_segments,zorder=0)
    lcol.set_array(my_np.ones(len(d)))
    lcol.set_linewidths(my_np.full(a,0.5))

    pic = my_plt.figure()
    my_plt.plot(b,d,'r.',markersize=10)
    my_plt.plot(b,d_fit,'g.-',markersize=10)
    my_plt.plot(b,my_lr.predict(b[:,my_np.newaxis]),'b-')

    my_plt.legend(('Data point','Isotonic fit','Linear fit'),loc='lower right')
    my_plt.title('Isotonic Regression Vs Linear Regression')
    my_plt.show()
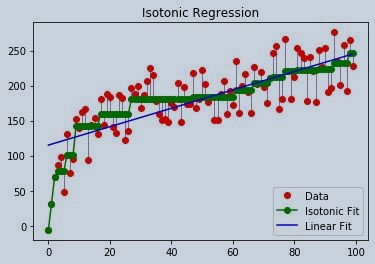
Figure 2 : Isotonic Regression Implemenation
Conclusion and Summary
Here in this example we can see that isotonic regression finds a non-decreasing approximation of a function. The advantage of isotonic regression models is that it does not assume target function such as linearity. For reference, linear regression is also plotted with isotonic regression.
So, in this article we have seen the basics of isotonic regression and how isotonic regression is more flexible than linear regression. We have also seen the advantage and disadvantage of isotonic regression. And at last we saw how we can use isotonic regression in python. If you want to learn linear regression, check this blog on Linear Regression from scratch in Python.
About the Author's:
Write A Public Review