Table of Content
Define the expected outcomes from your project or solution
Decide on the state of data to use
Data in Use
Data in Motion
Data at Rest
Identification of Source System
Finalize the form of data
Select your infrastructure
Extract the data to use in the project
Analyse the Data Dictionary
Scan through the surface of data using Spreadsheet Application
Identify your Objective Function or Problem Statement
Design your ML Pipeline
Model Fit
Model Evaluation Metric Selection
Creating your first machine learning project from scratch !
There are many tutorials, blogs and training material for learning machine learning on internet. Prior to this I have written an exhaustive article on data science career path. One of the important steps in building your career as a student is showcasing your ML skills to gain recognition. If we think of machine learning, data science or artificial intelligence as a career skill then there are stages of processing. All these stages need proper nurturing to improve your valuation as an asset to any organization. We have already discussed these stage in the data science career path blog. I will now focus on how to create your first machine learning project.
Step 1 : Define the expected outcomes from your project or solution.
Before you start your project planning and structuring, the first step would be to ideate as to what's the objective. Document the objective of your project. Most of the time, even with seasoned practitioner's, its observed that documentation begins in the end. Avoid this mistake. Start documenting on day one. Pick up a tool like Microsoft Word or an open source alternative like LibreOffice. I prefer LibreOffice as a complete tool for my ML project documentation. You can use the text for plain vanilla project write-ups. Drawing option is useful for data flow diagrams. Spreadsheet is useful for resource planning. Presentation layouts help you to convert your project into effective ML project portfolio's.
Fig 1 : Opensource Documentation Tool for your Machine Learning Projects : LibreOffice
Your journey from amateur to professional is a pretty long one. Set the course path for this. There has to be a start point and end point, which has to keep on evolving. At the moment, you can decide the end point of your ML project of these options.
Apply the skills learned, on the project
Learn new skills, while doing the project
Create a product which already exists
Develop a new product taking inspiration from already existing one
Create a new product with your intellectual property
I would recommend setting these objectives as gradients in your learning process. If this is your first machine learning capstone project, then set you objective as the first in the list. So the recommended objective in first iteration should be to apply the skills learned, on the project. At a later stage you should take up the remaining objectives in a sequential order. This treatment is required to set realistic and time bound project scope.
Step 2 : Decide on the state of data to use
Now that you have decided to "Apply the skills learned, on the project", you need to finalize the state of data being used. This will decide the next steps.
Fig 2 : Sates of Data
You need to decide on what premise you want to structure your project. Your machine learning project's structure and flow will depend on the state of data. Typically, there are three states of data.
Data in Use
Usually a part of a transaction system. Data in use is mostly a data base wherein the data is getting posted or updated constantly. For instance a retail stores transaction, call log data in telecom, bank transactions. This is the least unprocessed data, with an exception, which I will discuss in the exceptions.
Data in Motion
This refers to data which is moving from one node to another or is staged. We can consider the ETL phase of data processing as an example of same. Extract Transform Load(ETL) or Extract Load Transform(ELT) are data staging processes before being used in Analytical engine or reporting. Any data which is moving from one point to another, be it on the intranet or internet is Data in Motion.
Data at Rest
This refers to data stored on a server, hard disk or cloud with the intention of being archived or stored. You can consider data warehouse as an instance of the same. Any public data repository wherein users may download the data for use is also data at rest. A flat file in CSV format may also be considered as data at rest, when its not communicating with any frontend or transaction system. Its recommended to use data at rest state for your first project. This would keep things simple and let you focus on the core Machine Learning model development.
Exceptions in States of Data
There are times when certain rules are not applicable. For instance, although we say that Data at rest will have low level processing, exceptions do exist. Similarly, between each state of data there is a possibility that data may include two stages together. As an analogy you can consider states of matter i.e. solids, liquids, gases and plasma. Data state also may transform from one state to another. From a project science perspective, we will use Data at Rest to hone our machine learning skills learned in class.
Step 3 : Identification of Source System
Skipped for this project flow as we are using Data @ Rest. For Data in Use or Data in Motion this step needs to be executed. We would use static data available on public repository or donated by a known academic or industrial source. We have the option of simulating the data. Although we use the term skipped, it is not completely ignored.
The efforts we use in present flow for design is low. We don't study the database or data warehouse. Since its static dataset, we would go to the next step.
Step 4 : Finalize the form of data
There is a tendency for most of us to use image, video or audio form of data. At this stage you should avoid it. As a student, your priority should be to understand application of the principles of Machine Learning. Start with simple algorithms. This would need simple structured data. You should use data which has numerical and class based data. It should be structured and reasonable in terms of file size. The simplicity of your data, algorithm and expected output would make the next step pretty obvious. Before going ahead, have a look at the typical options you need to avoid in your first machine learning project.
Fig 3 : Some Complex form's of Data
Step 5 : Select your infrastructure
To start with the infrastructure, lets list out things we want to avoid. You should not use cloud infrastructure or server architecture. Since you are using data at rest, you need to have data as well as compute on your local system. This will make more sense for ease of execution. You can migrate your local flow onto a cloud very easily. So focus on your ML project from an algorithm perspective. Since I don't recommend using the cloud infrastructure, we will discuss the cloud options in the next edition of the blog.
From an application layer perspective you can use any of these options:
Python
R
From an Integrated Development Environment perspective you can use any of these options:
Anaconda Distribution for Python
RStudio Desktop Distribution for R
For rapid prototyping we can use these options:
ORANGE for Python
RATTLE for R
For Learning
ORANGE
RATTLE
The choice of the application for your Machine Learning project at this point should be R/Python. You may do it in R and then repeat in Python as well. This would give you a better learning curve. Also, implementing your data science skills in these two applications would fortify your learning experience. My preference for Python and R Language comes from the fact that these are open source. The other advantage's are exhaustive package availability, strong community support and user base.
You should simultaneously use Graphical User Interface applications in R/Python for rapid prototyping. This helps you to do some check on the data and see which algorithms are more suitable for your data. You should obviously do this once you have extracted the data.
Step 6 : Extract the data to use in the project
This step is very important. Somewhere your decisions at step 2 to 5 will influence this. In academic projects, many times we might be given a problem statement or dataset by the faculty. So in those rare instances, you can precede step 6 at step 2.
Some avenues to select your data sets:
UCI Machine Learning Respository
Kaggle
Google data search
While UCI and Kaggle are pretty straight forward to use. On Google data search link you will have to type in a keyword related to the topic of interest. If you want to do your Machine learning project on Credit risk in Bank then use keywords like default or credit risk.
Make sure that you take a dataset which is not very complex from the instance perspective (Record count/Row Numbers) and feature perspective (Feature/variable/column Numbers). Avoid heavy data sets, try to keep it light.
The domain, function or segment in which we want to work later, can be an aspect in the data repository we source. We can use domain like manufacturing, health care, services, politics, electronics, electrical and so on. Examples of function could be marketing, human resource, accounts, research, finance, operations and so on. Segments instances could be something like market, population, sports, network, customer and so on.
Step 7 : Analyze the Data Dictionary
Most of the public datasets would have a data dictionary. This is a document which should have the following parameters.
Source of data
Data Structure
Name of fields/columns/features/variables
Datatypes of fields/columns/features/variables
Size of fields/columns/features/variables
Number of Instances and features
Citations if any
Default values for fields if applicable
Exceptions to representation of specific values if any
Data dictionary typically is a metadata which explains about the data without actually looking at the content. You can think of it as a preface of a book title. The author gives an introduction, the motive, inspiration and also suggestions to optimally use the content.
As part of the documentation process of your project, make sure that if the data dictionary is not available, you need to create one.
Step 8 : Scan through the surface of data using Spreadsheet Application
Before you start analyzing the data using your preferred ML tool, it makes more sense to go through it in plane vanilla form. The old excel or any other spreadsheet application should not be missed. Use it effectively to understand the data better. If we want to win the race, we should get familiar with the route. Remember what old granny told, if you want to relish your food, take small bites. Take small samples or instances of your data and study it in basic spreadsheets. The regular pivots and charts would help you understand the data better. While all of this is going on, remember to continue documenting your project.
Step 9 : Identify your Objective Function or Problem Statement
By this time you should have got familiarized with the data to the extent that you are clear with the problem statement. Any ML project will ultimately end as either a prediction or classification algorithm. Theoretically, we know that if it's a continuous dependent or target variable then we are working on a prediction problem. If it's a dataset having the target variable as a class based data, then it's a classification problem. When you are selecting your project, the related dataset, try to zero in on a classification problem. Most of your real life business problem's will fall in this bucket. As we are doing a beginner level project in ML, try to work on a supervised learning process.
Step 10 : Design your ML Pipeline
For your learning ML Project, you need not follow a complex workflow. Try to use simple workflow. Have a look at the example given in figure 4 below.
Figure 4 : Machine Learning Project Pipeline
Although this is a simple framework, there is a lot of art involved apart from the science. At every step you have to analyze and note the possibilities of refinement in the model development. We have kept it simple over here and done the feature transformations before shuffling and splitting of data. In production environment, we may have a differing approach altogether. As the state, type and form of data changes the approach for pipelines will change.
Step 11 : Model Fit
Maintain a fine balance between the bias and variance of your model. Optimizing on both ends is always going to be a challenge. The shuffle and split part in previous step is going to be an important factor in controlling the variance of your model. The participating candidate models would be instrumental in the bias optimization. In production environment there might be important things to consider. Some of these are data step, variable selection, candidate models, cross validation techniques, data split proportions and model update frequency. In this academic project of yours, you need to start looking from those perspectives.
Step 12 : Model Evaluation Metric Selection
While presenting your model from an evaluation perspective, make sure your select the right metrics. Most of the time students look at only accuracy as a measure. But these are only applicable in balanced datasets. In real life we ideally don't have these. Academic exercise of balancing datasets using sampling and other techniques is sometimes illogical. I haven't seen a scenario in sales wherein out of my lead funnel, 50% customers have converted. So simulating an environment to create an artificial balanced dataset is not always in the right direction.
These steps are directional and should be revisited and iterated again if we are unable to achieve the desired results. Here we have tried to "Apply the skills learned, on the project". In the next blog series I will pen down the approach to "Learn new skills, while doing the project".
About the Author:
Mohan Rai
Mohan Rai is an Alumni of IIM Bangalore , he has completed his MBA from University of Pune and Bachelor of Science (Statistics) from University of Pune. He is a Certified Data Scientist by EMC.Mohan is a learner and has been enriching his experience throughout his career by exposing himself to several opportunities in the capacity of an Advisor, Consultant and a Business Owner. He has more than 18 years’ experience in the field of Analytics and has worked as an Analytics SME on domains ranging from IT, Banking, Construction, Real Estate, Automobile, Component Manufacturing and Retail. His functional scope covers areas including Training, Research, Sales, Market Research, Sales Planning, and Market Strategy.
Table of Content
- Define the expected outcomes from your project or solution
- Decide on the state of data to use
- Data in Use
- Data in Motion
- Data at Rest
- Identification of Source System
- Finalize the form of data
- Select your infrastructure
- Extract the data to use in the project
- Analyse the Data Dictionary
- Scan through the surface of data using Spreadsheet Application
- Identify your Objective Function or Problem Statement
- Design your ML Pipeline
- Model Fit
- Model Evaluation Metric Selection
Creating your first machine learning project from scratch !
There are many tutorials, blogs and training material for learning machine learning on internet. Prior to this I have written an exhaustive article on data science career path. One of the important steps in building your career as a student is showcasing your ML skills to gain recognition. If we think of machine learning, data science or artificial intelligence as a career skill then there are stages of processing. All these stages need proper nurturing to improve your valuation as an asset to any organization. We have already discussed these stage in the data science career path blog. I will now focus on how to create your first machine learning project.
Before you start your project planning and structuring, the first step would be to ideate as to what's the objective. Document the objective of your project. Most of the time, even with seasoned practitioner's, its observed that documentation begins in the end. Avoid this mistake. Start documenting on day one. Pick up a tool like Microsoft Word or an open source alternative like LibreOffice. I prefer LibreOffice as a complete tool for my ML project documentation. You can use the text for plain vanilla project write-ups. Drawing option is useful for data flow diagrams. Spreadsheet is useful for resource planning. Presentation layouts help you to convert your project into effective ML project portfolio's.
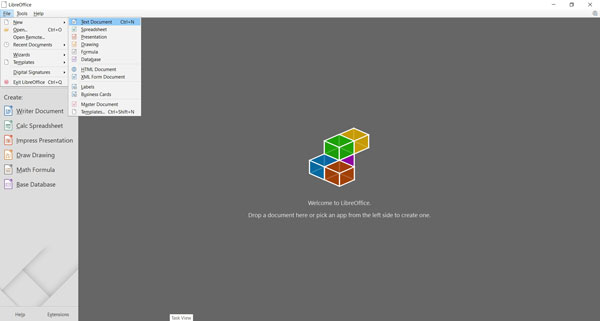
Fig 1 : Opensource Documentation Tool for your Machine Learning Projects : LibreOffice
Your journey from amateur to professional is a pretty long one. Set the course path for this. There has to be a start point and end point, which has to keep on evolving. At the moment, you can decide the end point of your ML project of these options.
- Apply the skills learned, on the project
- Learn new skills, while doing the project
- Create a product which already exists
- Develop a new product taking inspiration from already existing one
- Create a new product with your intellectual property
I would recommend setting these objectives as gradients in your learning process. If this is your first machine learning capstone project, then set you objective as the first in the list. So the recommended objective in first iteration should be to apply the skills learned, on the project. At a later stage you should take up the remaining objectives in a sequential order. This treatment is required to set realistic and time bound project scope.
Now that you have decided to "Apply the skills learned, on the project", you need to finalize the state of data being used. This will decide the next steps.
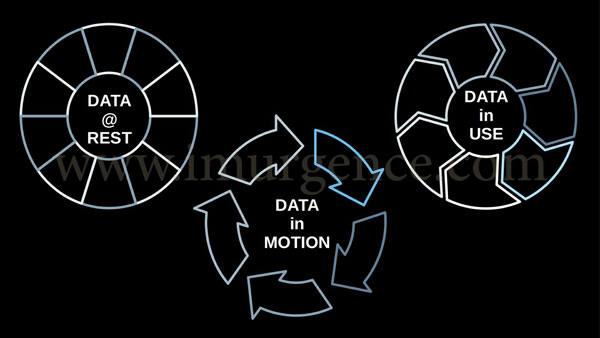
Fig 2 : Sates of Data
You need to decide on what premise you want to structure your project. Your machine learning project's structure and flow will depend on the state of data. Typically, there are three states of data.
Usually a part of a transaction system. Data in use is mostly a data base wherein the data is getting posted or updated constantly. For instance a retail stores transaction, call log data in telecom, bank transactions. This is the least unprocessed data, with an exception, which I will discuss in the exceptions.
This refers to data which is moving from one node to another or is staged. We can consider the ETL phase of data processing as an example of same. Extract Transform Load(ETL) or Extract Load Transform(ELT) are data staging processes before being used in Analytical engine or reporting. Any data which is moving from one point to another, be it on the intranet or internet is Data in Motion.
This refers to data stored on a server, hard disk or cloud with the intention of being archived or stored. You can consider data warehouse as an instance of the same. Any public data repository wherein users may download the data for use is also data at rest. A flat file in CSV format may also be considered as data at rest, when its not communicating with any frontend or transaction system. Its recommended to use data at rest state for your first project. This would keep things simple and let you focus on the core Machine Learning model development.
Exceptions in States of Data
There are times when certain rules are not applicable. For instance, although we say that Data at rest will have low level processing, exceptions do exist. Similarly, between each state of data there is a possibility that data may include two stages together. As an analogy you can consider states of matter i.e. solids, liquids, gases and plasma. Data state also may transform from one state to another. From a project science perspective, we will use Data at Rest to hone our machine learning skills learned in class.
Skipped for this project flow as we are using Data @ Rest. For Data in Use or Data in Motion this step needs to be executed. We would use static data available on public repository or donated by a known academic or industrial source. We have the option of simulating the data. Although we use the term skipped, it is not completely ignored.
The efforts we use in present flow for design is low. We don't study the database or data warehouse. Since its static dataset, we would go to the next step.
There is a tendency for most of us to use image, video or audio form of data. At this stage you should avoid it. As a student, your priority should be to understand application of the principles of Machine Learning. Start with simple algorithms. This would need simple structured data. You should use data which has numerical and class based data. It should be structured and reasonable in terms of file size. The simplicity of your data, algorithm and expected output would make the next step pretty obvious. Before going ahead, have a look at the typical options you need to avoid in your first machine learning project.

Fig 3 : Some Complex form's of Data
To start with the infrastructure, lets list out things we want to avoid. You should not use cloud infrastructure or server architecture. Since you are using data at rest, you need to have data as well as compute on your local system. This will make more sense for ease of execution. You can migrate your local flow onto a cloud very easily. So focus on your ML project from an algorithm perspective. Since I don't recommend using the cloud infrastructure, we will discuss the cloud options in the next edition of the blog.
From an application layer perspective you can use any of these options:
- Python
- R
From an Integrated Development Environment perspective you can use any of these options:
- Anaconda Distribution for Python
- RStudio Desktop Distribution for R
For rapid prototyping we can use these options:
- ORANGE for Python
- RATTLE for R
For Learning
- ORANGE
- RATTLE
The choice of the application for your Machine Learning project at this point should be R/Python. You may do it in R and then repeat in Python as well. This would give you a better learning curve. Also, implementing your data science skills in these two applications would fortify your learning experience. My preference for Python and R Language comes from the fact that these are open source. The other advantage's are exhaustive package availability, strong community support and user base.
You should simultaneously use Graphical User Interface applications in R/Python for rapid prototyping. This helps you to do some check on the data and see which algorithms are more suitable for your data. You should obviously do this once you have extracted the data.
Step 6 :
This step is very important. Somewhere your decisions at step 2 to 5 will influence this. In academic projects, many times we might be given a problem statement or dataset by the faculty. So in those rare instances, you can precede step 6 at step 2.
Some avenues to select your data sets:
- UCI Machine Learning Respository
- Kaggle
- Google data search
While UCI and Kaggle are pretty straight forward to use. On Google data search link you will have to type in a keyword related to the topic of interest. If you want to do your Machine learning project on Credit risk in Bank then use keywords like default or credit risk.
Make sure that you take a dataset which is not very complex from the instance perspective (Record count/Row Numbers) and feature perspective (Feature/variable/column Numbers). Avoid heavy data sets, try to keep it light.
The domain, function or segment in which we want to work later, can be an aspect in the data repository we source. We can use domain like manufacturing, health care, services, politics, electronics, electrical and so on. Examples of function could be marketing, human resource, accounts, research, finance, operations and so on. Segments instances could be something like market, population, sports, network, customer and so on.
Most of the public datasets would have a data dictionary. This is a document which should have the following parameters.
- Source of data
- Data Structure
- Name of fields/columns/features/variables
- Datatypes of fields/columns/features/variables
- Size of fields/columns/features/variables
- Number of Instances and features
- Citations if any
- Default values for fields if applicable
- Exceptions to representation of specific values if any
Data dictionary typically is a metadata which explains about the data without actually looking at the content. You can think of it as a preface of a book title. The author gives an introduction, the motive, inspiration and also suggestions to optimally use the content.
As part of the documentation process of your project, make sure that if the data dictionary is not available, you need to create one.
Before you start analyzing the data using your preferred ML tool, it makes more sense to go through it in plane vanilla form. The old excel or any other spreadsheet application should not be missed. Use it effectively to understand the data better. If we want to win the race, we should get familiar with the route. Remember what old granny told, if you want to relish your food, take small bites. Take small samples or instances of your data and study it in basic spreadsheets. The regular pivots and charts would help you understand the data better. While all of this is going on, remember to continue documenting your project.
By this time you should have got familiarized with the data to the extent that you are clear with the problem statement. Any ML project will ultimately end as either a prediction or classification algorithm. Theoretically, we know that if it's a continuous dependent or target variable then we are working on a prediction problem. If it's a dataset having the target variable as a class based data, then it's a classification problem. When you are selecting your project, the related dataset, try to zero in on a classification problem. Most of your real life business problem's will fall in this bucket. As we are doing a beginner level project in ML, try to work on a supervised learning process.
For your learning ML Project, you need not follow a complex workflow. Try to use simple workflow. Have a look at the example given in figure 4 below.
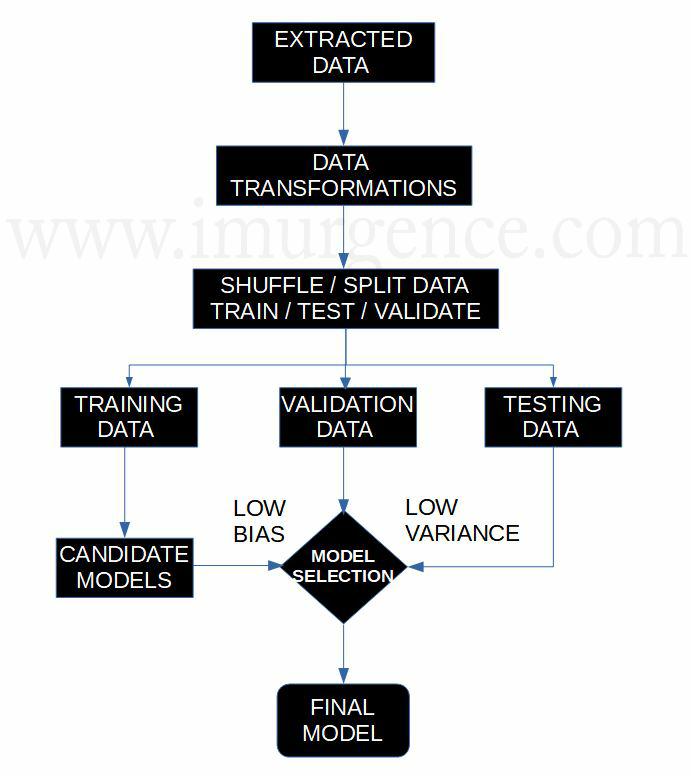
Figure 4 : Machine Learning Project Pipeline
Although this is a simple framework, there is a lot of art involved apart from the science. At every step you have to analyze and note the possibilities of refinement in the model development. We have kept it simple over here and done the feature transformations before shuffling and splitting of data. In production environment, we may have a differing approach altogether. As the state, type and form of data changes the approach for pipelines will change.
Maintain a fine balance between the bias and variance of your model. Optimizing on both ends is always going to be a challenge. The shuffle and split part in previous step is going to be an important factor in controlling the variance of your model. The participating candidate models would be instrumental in the bias optimization. In production environment there might be important things to consider. Some of these are data step, variable selection, candidate models, cross validation techniques, data split proportions and model update frequency. In this academic project of yours, you need to start looking from those perspectives.
While presenting your model from an evaluation perspective, make sure your select the right metrics. Most of the time students look at only accuracy as a measure. But these are only applicable in balanced datasets. In real life we ideally don't have these. Academic exercise of balancing datasets using sampling and other techniques is sometimes illogical. I haven't seen a scenario in sales wherein out of my lead funnel, 50% customers have converted. So simulating an environment to create an artificial balanced dataset is not always in the right direction.
These steps are directional and should be revisited and iterated again if we are unable to achieve the desired results. Here we have tried to "Apply the skills learned, on the project". In the next blog series I will pen down the approach to "Learn new skills, while doing the project".
About the Author:

Write A Public Review